

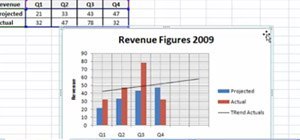
How to use trendlines in Excell 2007
In this tutorial I will show you how to use trendlines in microsoft excell 2007. Trendlines can only be used for certain types of charts.
Charts that cannot be used for a trendline:
- Stacked-chart, 3D, Radar, Pie-chart, surface-chart, donut-chart
Let me show you step by step how to create a trendline:
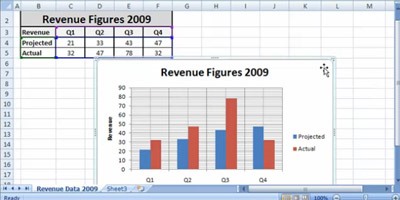
Step 1 Go to the "design tab" to change your chart type
Step 2 Change to a clustered column chart (as an example)
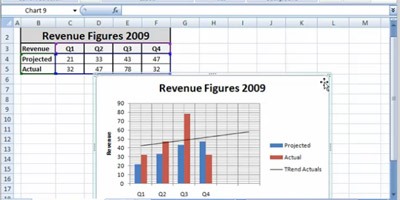
Step 3 Go to chart tools
This is where you can select trendline options. Now you can choose between 4 different types of trendline: Linear, exponential, Linear forecast, two period moving average.
If you have more than one data series for your chart, you can choose which data series you would like to add the trendline.
Step 4 Changing the legend layout (to the side of the chart)
Select the Legend that you are working on in your Excell sheet. (You can change the name for the trendline name in the legend menu, which is part of the chart tools.)
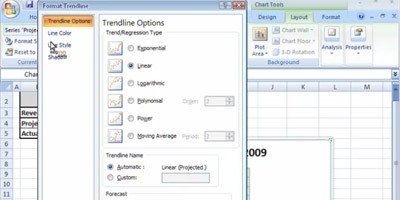
Step 5 Trendline options
You can format the trendline by selecting it in the dropdown menu on the left of the chart tools tab. Here you can change the attributes and the name of the trendline. (colour, type, etc.)
Tips
- You can add various trendlines to the same chart for each individual data serie.
- View the video tutorial here.
Just updated your iPhone? You'll find new emoji, enhanced security, podcast transcripts, Apple Cash virtual numbers, and other useful features. There are even new additions hidden within Safari. Find out what's new and changed on your iPhone with the iOS 17.4 update.


Be the First to Comment
Share Your Thoughts